Showing posts with label check_mk. Show all posts

Thursday, March 1, 2018

[Check_MK + OMS Log Analytics] - Using Log Analytics Data Collector API

So, it's been a while since i wrote something here.
Not that i've lots of visualizations, but as i said before, i use this not only as a knowlodge share 'platform' and an hobbie, but also as my notebook :)

I've been self challanged to send or integrate if you like, some Check_MK alerts with OMS Log Analytics.

So, i've decided to give it a shot.

The scenario was to send all Check_MK alerts to OMS Log Analytics and later make some analysis about that, and other data that i'm already sending there (i'll make a post about it later - something about Powershell + MSSQL data -> Azure) - Perhaps tomorow i'll post it here.

So - Check_MK has a notifications system almost like Operations Manager.
It's very flexible about what you want to notificate and whom.

You might want to read it a little more here:

http://mathias-kettner.com/checkmk_flexible_notifications.html

After googling a bit, a came across with an article about posting data using the HTTP Data Collector API, where it has a bunch of examples about how to post data to OMS - check it here :

https://docs.microsoft.com/en-us/azure/log-analytics/log-analytics-data-collector-api

Resuming a little bit, basically your input data needs to be like this :

{
"property1": "value1",
" property 2": "value2"
" property 3": "value3",
" property 4": "value4"
}

So, after knowing this, this is the Check_MK notification script i came up with (Python):


#!/usr/bin/env python
import os, sys, time, subprocess, json, requests, datetime, hashlib, hmac, base64

# HTTP/HTTPS Proxies - If you need some ... #

os.environ["HTTP_PROXY"] = 'http://:/'
os.environ["HTTPS_PROXY"] = 'https://:/'

# OMS Related Variables #
customer_id = 'xxxxxxx-xxxx-xxxx-xxxx-xxxxxxxxxxxx'
shared_key = "xxxxxxxxxxxxxxxxxxxxxxxxxxxxxx"
log_type = 'Your_Custom_Log_Name'

# OMS Related Functions #

# Build the API signature
def build_signature(customer_id, shared_key, date, content_length, method, content_type, resource):
    x_headers = 'x-ms-date:' + date
    string_to_hash = method + "\n" + str(content_length) + "\n" + content_type + "\n" + x_headers + "\n" + resource
    bytes_to_hash = bytes(string_to_hash).encode('utf-8')
    decoded_key = base64.b64decode(shared_key)
    encoded_hash = base64.b64encode(hmac.new(decoded_key, bytes_to_hash, digestmod=hashlib.sha256).digest())
    authorization = "SharedKey {}:{}".format(customer_id,encoded_hash)
    return authorization

# Build and send a request to the POST API
def post_data(customer_id, shared_key, body, log_type):
    method = 'POST'
    content_type = 'application/json'
    resource = '/api/logs'
    rfc1123date = datetime.datetime.utcnow().strftime('%a, %d %b %Y %H:%M:%S GMT')
    content_length = len(body)
    signature = build_signature(customer_id, shared_key, rfc1123date, content_length, method, content_type, resource)
    uri = 'https://' + customer_id + '.ods.opinsights.azure.com' + resource + '?api-version=2016-04-01'

    headers = {
        'content-type': content_type,
        'Authorization': signature,
        'Log-Type': log_type,
        'x-ms-date': rfc1123date
    }

    response = requests.post(uri,data=body, headers=headers)
    if (response.status_code >= 200 and response.status_code <= 299):
        print 'Accepted'
    else:
        print "Response code: {}".format(response.status_code)

# MK Alert Handling #

MK_HOSTNAME = os.environ['NOTIFY_HOSTNAME']
MK_DESCRIPTION = os.environ['NOTIFY_SERVICEOUTPUT']
MK_PLUGIN_OUTPUT = os.environ['NOTIFY_SERVICEDESC']
MK_LAST_STATE_CHANGE = time.strftime("%Y-%m-%d %H:%M:%S")
MK_SERVICESTATE = os.environ['NOTIFY_SERVICESTATE']

MK_HOST_IP = NEW_INFO.split(",")[0]
MK_DATACENTER = NEW_INFO.split(",")[1]
MK_TEAM = NEW_INFO.split(",")[2]
MK_VENDOR = NEW_INFO.split(",")[3].replace('\n','')

MK_JSON_OUTPUT = json.dumps([{'mk_hostname': MK_HOSTNAME, 'mk_description': MK_DESCRIPTION, 'mk_plugin_output': MK_PLUGIN_OUTPUT, 'mk_last_state_chage': MK_LAST_STATE_CHANGE, 'mk_servicestate': MK_SERVICESTATE }])

post_data(customer_id, shared_key, MK_JSON_OUTPUT, log_type)

After yout get this as an active notification method on your Check_MK site, you'll start to see data getting in OMS like :


This is really nice to have - the OMS analytics engine is awesome and gives you a lot of possibilities.

Obiously, you might want to use the above example on anything you want to, so, your imagination could simply adapt this to your own case scenario.

Hope you all like this thread, and i promise to post things here more frequently.

Cheers,

Friday, May 13, 2016

Nagios/Check_MK Alerts to SCOM (OpsMgr) using Orchestrator

Recently a customer needed to process 'tons' of snmp traps from several equipments, from several vendors, and some, snmp v3 traps, these not supported by OpsMgr. But still forward those alerts to Operations Manager.
So, i built a Nagios server! Yes Nagios! Nagios, no matter what, can and it's usefull.
And it's helping us a lot.
I decided to go for what i like the most - OMD (omdistro.com), so this is made specific for Check_MK configuration, but you can 'port' it to Nagios Core.

So. Nagios installed, lot's of equipment configured, snmpd configured, mibs copied, and tons of traps received, problem solved!
Now, forward those alerts to SCOM!

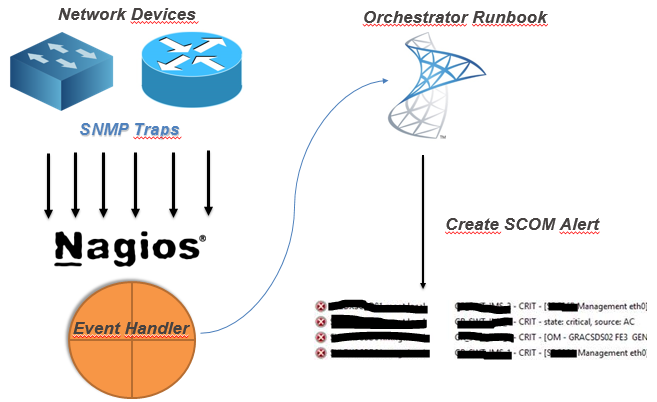
My idea (and working idea!) :

(yes, this was the powerpoint i sent to the customer! - hahah!)


So, after you've your monitoring criteria in Nagios configured, you need to :
  1. Create a Orchestrator Runbook that receives some parameters
  2. Create Nagios Event-Handler to 'consume' that runbook by orchestrator web-service


So, my Orchestrator Runbook :


Details about the MKAlertInput :


Create Alert details :


So, since i've got my runbook, i need to make a bash script to consume orchestrator runbook.
But, first, you need to know :
Your new runbook ID
And your runbook parameters ID
How ? Simple !
Connect to your MSSQL Server (Orchestrator BD) and run this :

 -- Runbook ID
 SELECT   
 Name as 'Runbook Name',  
 LOWER(ID) as 'Runbook ID'  
 FROM [Orchestrator].[Microsoft.SystemCenter.Orchestrator].[Runbooks]  
 -- Parameters ID
 SELECT LOWER(Parameters.Id) , Parameters.Name  
 FROM [Orchestrator].[Microsoft.SystemCenter.Orchestrator].[RunbookParameters] AS Parameters  
 INNER JOIN [Orchestrator].[Microsoft.SystemCenter.Orchestrator].[Runbooks] Runbooks ON Parameters.RunbookId = Runbooks.Id  
 -- THIS ID Showld be the one from the first query!  
 WHERE Runbooks.Id = '0B3E5FA3-A2E9-4337-BC63-050FC347A908'   

Since you got the ID's you need, you need to create your Nagios Event Handler, so every time you've na alert you can handle it and forward it to SCOM.


So, my script (for this scenario!)
 #!/bin/sh  
 # Nagios input data into vars#  
 host_name="$1"  
 description="$3"  
 plugin_output="$3 | $4 @ $5"  
 last_state_change=`date +"%d-%m-%Y %T"`  
 servicestate="$2"  
 # Orchestrator Info #  
 url='http://ORCHSERVER:81/Orchestrator2012/Orchestrator.svc/Jobs/'  
 user='DOMAIN\ORCHUSER'  
 password='ORCHPASSWORD'  
 case "$servicestate" in  
     OK)  
         echo ""  
     ;;  
     WARNING)  
         echo ""  
     ;;  
     CRITICAL)  
         xml="<?xml version=\"1.0\" encoding=\"utf-8\" standalone=\"yes\"?><entry xmlns:d=\"http://schemas.microsoft.com/ado/2007/08/dataservices\" xmlns:m=\"http://schemas.microsoft.com/ado/2007/08/dataservices/metadata\" xmlns=\"http://www.w3.org/2005/Atom\"><content type=\"application/xml\"><m:properties><d:Parameters>&lt;Data&gt;&lt;Parameter&gt;&lt;Name&gt;host_name&lt;/Name&gt;&lt;ID&gt;{c2555c8a-4c1c-4c04-a175-d27ccb27aeb3}&lt;/ID&gt;&lt;Value&gt;$host_name&lt;/Value&gt;&lt;/Parameter&gt;&lt;Parameter&gt;&lt;Name&gt;description&lt;/Name&gt;&lt;ID&gt;{e47406b6-fbd7-4bc5-b7a5-a1216f4fdfe5}&lt;/ID&gt;&lt;Value&gt;$description&lt;/Value&gt;&lt;/Parameter&gt;&lt;Parameter&gt;&lt;Name&gt;plugin_output&lt;/Name&gt;&lt;ID&gt;{406620e8-5fc0-4318-ad6b-987d9d491b09}&lt;/ID&gt;&lt;Value&gt;$plugin_output&lt;/Value&gt;&lt;/Parameter&gt;&lt;Parameter&gt;&lt;Name&gt;last_state_change&lt;/Name&gt;&lt;ID&gt;{35ab0932-df75-42d0-9715-935d3510b532}&lt;/ID&gt;&lt;Value&gt;$last_state_change&lt;/Value&gt;&lt;/Parameter&gt;&lt;/Data&gt;</d:Parameters><d:RunbookId type=\"Edm.Guid\">0b3e5fa3-a2e9-4337-bc63-050fc347a908</d:RunbookId></m:properties></content></entry>"  
         # XML 2 File  
         xml_file=`< /dev/urandom tr -dc _A-Z-a-z-0-9 | head -c10`  
         echo "$xml" > /tmp/$xml_file  
         # Post data into SCOrch Web-Service  
         curl --ntlm -u $user:$password -H 'Content-Type:application/atom+xml' -d @/tmp/$xml_file -X POST $url  
         ;;  
     UNKNOWN)  
         echo ""  
         ;;  
 esac  

Now, you need to tell nagios to use this script, so paste this config : (Remember, i'm using Check_MK)
 extra_nagios_conf += r"""  
 define command {  
   command_name  scorchws  
   command_line  /omd/sites/nagdsv/gdc/bin/orchestratorws.sh "$HOSTNAME$" "$SERVICESTATE$" "$SERVICEDESC$" "$SERVICEOUTPUT$" "$HOSTGROUPNAMES$"  
 }  
 """  
 extra_service_conf["event_handler"] = [  
   ( "scorchws", ALL_HOSTS, ALL_SERVICES ),  
 ]  
 extra_service_conf["event_handler_enabled"] = [  
   ( "1", ALL_HOSTS, ALL_SERVICES ),  
 ]  

Everything in place … this is what you get in SCOM :

Hope this could be helpful for you :)

Cheers,