Showing posts with label scom groups. Show all posts

Thursday, September 8, 2016

OpsMgr (SCOM) - NTP Deviation Monitor (VBScript)

OpsMgr by default doesn't evaluate the deviation between the NTP server time and the server/workstation time, and since there are some critical services that require this deviation to be almost 0, i've decided to create a three-state monitor for this evaluation.

First, create a "Timed Script Three State Monitor" on the Authoring pane (Create a Monitor) - select "Unit Monitor"
Associate it to a brand new MP.


Then, target it to Windows Computer. I've decided to select "Configuration" to it's parent monitor (this is up to you!).
Also decided to NOT ENABLE IT by default.


Next, select the most effective schedule for you, i've decided to leave it to 5 minutes.


Fill the file name also as the script area, with this script :
(As you might notice, part of this code is from Nagios check check_time.vbs - credits go to the Author : Dmitry Vayntrub (dvayntrub@yahoo.com) )

 Dim oAPI, oBag  
 Set oAPI = CreateObject("MOM.ScriptAPI")  
 Set oBag = oAPI.CreatePropertyBag()  
 Set objWMISvc = GetObject( "winmgmts:\\.\root\cimv2" )  
 Set colItems = objWMISvc.ExecQuery( "Select * from Win32_ComputerSystem" )  
 For Each objItem in colItems  
   strComputerDomain = objItem.Domain  
 Next  
 Set objShell = CreateObject("Wscript.Shell")  
 strCommand = "%SystemRoot%\System32\w32tm.exe /monitor /nowarn /computers:" & strComputerDomain  
 set objProc = objShell.Exec(strCommand)  
 warn = "5"  
 crit = "10"  
 input = ""  
 strOutput = ""  
 Do While Not objProc.StdOut.AtEndOfStream  
     input = objProc.StdOut.ReadLine  
     If InStr(input, "NTP") Then  
         strOutput = strOutput & input  
     End If  
 Loop  
 Set myRegExp = New RegExp  
 myRegExp.IgnoreCase = True  
 myRegExp.Global = True  
 myRegExp.Pattern = " NTP: ([+-][0-9]+\.[0-9]+)s"  
 Set myMatches = myRegExp.Execute(strOutput)  
 result = ""  
 If myMatches(0).SubMatches(0) <> "" Then  
     result = myMatches(0).SubMatches(0)  
 End If  
 For Each myMatch in myMatches  
     If myMatch.SubMatches(0) <> "" Then  
             If abs(result) > Abs(myMatch.SubMatches(0)) Then  
                 result = myMatch.SubMatches(0)  
             End If  
     End If  
 Next  
 If result = "" Then  
     Err = 3  
     Status = "UNKNOWN"  
  ElseIf result > crit Then  
     Err = 2  
     status = "CRITICAL"  
  ElseIf result > warn Then  
     Err = 1  
     status = "WARNING"  
  Else  
     Err = 0  
     status = "OK"  
 End If  
 Call oBag.AddValue("NTPStatus",status)  
 Call oAPI.Return(oBag)  


Next, we'll set the expressions (Unhealthy, Degraded and Healthy).
As you might notice i populated the Property Bag with parameter name as "NTPStatus" so you need to name your Parameter Name as follow :


Let the configure health step as it is.

For last, configure the alert rising as follows :


Now you need to override the monitor to a group or class as you prefer, and this is what it would like:


And that's it!

Hope you enjoy!

Thursday, April 7, 2016

OpsMgr (SCOM) - Create Performance Charts in Powershell

It might be usefull for people who don't have Datazen or just want to create and manage their own costumized HTML views, or perhaps, for fun!

Powershell is one of the things i like the most while exploring everything that SCOM (and other System Center tools) can give to you, it just makes everything you want, a way or another.

So.

What about creating this in a Powershell script ?


This is the script that does all the magic :

!!NOTE!! : For the most problematic servers in specific groups i've i retrieve memory, cpu, and disk usage performance data, but, you change this logic as well as the performance counters.

Please attempt to the comments in-line so you can understand the logic :)
 [void][Reflection.Assembly]::LoadWithPartialName("System.Windows.Forms.DataVisualization")  
 Import-Module OperationsManager  
 New-SCOMManagementGroupConnection -ComputerName "opsmgr.server.local" #Change here :)  
 $script:scriptpath = "C:\PS\OpsMgr_PerfCharts\images"  
   
 # Foreach Group above list the most problematic agents   
   
 $MyGroups = @()  
 $MyGroups += Get-SCOMGroup -DisplayName 'UNIX/Linux Computer Group'  
 $MyGroups += Get-SCOMGroup -DisplayName 'All Windows Computers'  
 $newTime = (Get-Date).AddHours(-24)  
 $Criteria = New-Object Microsoft.EnterpriseManagement.Monitoring.MonitoringAlertCriteria("TimeRaised > `'$newTime`'")  
 $TransversalDepth = [Microsoft.EnterpriseManagement.Common.TraversalDepth]::Recursive  
 $TopAgents = @()  
 Foreach ( $Group in $MyGroups ) {  
   $TopObjAlerts = ($Group.GetMonitoringAlerts($Criteria , $TransversalDepth) | Group-Object MonitoringObjectPath | Sort-Object count -descending | select -first 5 Values).Values  
   Foreach ($i in $TopObjAlerts) {  
     $TopAgents += ($i -split ";")[0]  
   }  
   $TopAgents = $TopAgents.Split(";",[System.StringSplitOptions]::RemoveEmptyEntries)  
 }  
 $Count = 0  
 $Query = ""  
 Foreach ($Agent in $TopAgents) {  
   If ($TopAgents.Count -eq $Count ) {  
     $Query += "'" + $agent + "'" + ","  
   } Else { $Query += "'" + $agent + "'" }  
   $Count++  
 }  
   
 # Create SQL Query with the most problematic agents criteria   
   
 $Query = $Query -replace "''","','"  
   
 $SqlQuery = "  
 SELECT          
     Path,  
     DateTime,  
     CASE   
     WHEN vpr.ObjectName = 'Processor Information' THEN 'Processor'  
     WHEN vpr.ObjectName = 'LogicalDisk' THEN 'Logical Disk' ELSE vpr.ObjectName END as ObjectName,  
 CASE   
     WHEN vpr.CounterName = 'PercentMemoryUsed' OR vpr.CounterName = '% Available Memory' THEN '% Used Memory'   
     WHEN vpr.CounterName = '% Free Space' THEN '% Used Space'  
     ELSE vpr.CounterName END as CounterName,  
 CASE   
     WHEN len(vpri.InstanceName) < 1 THEN '_Total' ELSE vpri.InstanceName END as InstanceName,  
 CASE   
     WHEN vpr.CounterName = '% Available Memory' or vpr.CounterName = '% Free Space' THEN 100 - pvpr.AverageValue ELSE pvpr.AverageValue END as AverageValue,  
 100.00 as ComparisonValue  
 FROM   
     Perf.vPerfDaily pvpr WITH (NOLOCK)   
     inner join vManagedEntity vme WITH (NOLOCK) on pvpr.ManagedEntityRowId = vme.ManagedEntityRowId   
     inner join vPerformanceRuleInstance vpri WITH (NOLOCK) on pvpr.PerformanceRuleInstanceRowId = vpri.PerformanceRuleInstanceRowId   
     inner join vPerformanceRule vpr WITH (NOLOCK) on vpr.RuleRowId = vpri.RuleRowId   
 WHERE  
     Path in (  
         select   
             unix.DisplayName  
         from   
             vManagedEntity unix WITH (NOLOCK)   
             join vManagedEntityManagementGroup unixMG WITH (NOLOCK) ON unix.ManagedEntityRowId = unixMG.ManagedEntityRowId  
             join vManagedEntityType unixType WITH (NOLOCK) on unix.ManagedEntityTypeRowId = unixType.ManagedEntityTypeRowId  
         where   
             unixMG.ToDateTime Is Null   
             and (unixType.ManagedEntityTypeSystemName = 'Microsoft.Unix.Computer'   
             or unixType.ManagedEntityTypeSystemName = 'Microsoft.Windows.Computer' )  
             AND vpr.ObjectName <> 'Process'  
             AND unix.DisplayName IN ( $Query )  
     )  
 AND vpr.CounterName in ('% Processor Time','PercentMemoryUsed','% Available Memory','% Free Space')  
 AND vpri.InstanceName in ('_Total','C:','/','')  
 AND DATEDIFF(DAY, pvpr.DateTime, GETDATE()) < 8  
 "  
   
 $SqlQuery > $env:TEMP\query.sql  
   
 $SqlQuery = Get-Content $env:TEMP\query.sql  
   
 # Create connection to SCOMDW Database   
   
 $script:SQLServer = "SCOMDBSERVER\SCOMDW"  
 $script:SQLDBName = "OperationsManagerDW"  
 $script:connString = "Data Source=$SQLServer;Initial Catalog=$SQLDBName;Integrated Security = True"  
 $script:connection = New-Object System.Data.SqlClient.SqlConnection($connString)  
 $connection.Open()  
 $sqlcmd = $connection.CreateCommand()  
 $sqlcmd.CommandText = $SqlQuery  
 $results = $sqlcmd.ExecuteReader()  
 $script:table = new-object “System.Data.DataTable”  
 $script:table.Load($results)  
   
 # Lets GRAPH!  
   
 $Servers = ($table | Select -Unique Path).Path  
 # 1 Graph foreach Agent   
 Foreach ( $Server in $Servers ) {  
   $Server = ($Server -split '\.')[0]  
   $GraphName = $Server  
   # Create CHART   
   $GraphName = New-object System.Windows.Forms.DataVisualization.Charting.Chart  
   $GraphName.Width = 900  
   $GraphName.Height = 300  
   $GraphName.BackColor = [System.Drawing.Color]::White  
   # CHART Title  
   [void]$GraphName.Titles.Add("$Server - Performance Data")  
   $GraphName.Titles[0].Font = "Arial,10pt"  
   $GraphName.Titles[0].Alignment = "MiddleCenter"  
   # CHART Area and X/Y sizes   
   $chartarea = New-Object System.Windows.Forms.DataVisualization.Charting.ChartArea  
   $chartarea.Name = "ChartArea"  
   $chartarea.AxisY.Title = "$CounterName"  
   $chartarea.AxisX.Title = "Time"  
   $chartarea.AxisY.Maximum = 100  
   $chartarea.AxisY.Interval = 10  
   $chartarea.AxisX.Interval = 1  
   $GraphName.ChartAreas.Add($chartarea)  
   # CHART Legend  
   $legend = New-Object system.Windows.Forms.DataVisualization.Charting.Legend  
   $legend.name = "Legend"  
   $GraphName.Legends.Add($legend)  
     # Line Colors  
     $num = 0  
   $LineColours = ('DarkBlue','Brown','DarkMagenta')  
   # Create 'n' SERIES (lines) for each COUNTER  
   Foreach ($Counter in $Counters) {  
     $LineColor = $LineColours[$num]  
     [void]$GraphName.Series.Add("$Counter")  
     $GraphName.Series["$Counter"].ChartType = "Line"  
     $GraphName.Series["$Counter"].BorderWidth = 2  
     $GraphName.Series["$Counter"].IsVisibleInLegend = $true  
     $GraphName.Series["$Counter"].chartarea = "ChartArea"  
     $GraphName.Series["$Counter"].Legend = "Legend"  
     $GraphName.Series["$Counter"].color = "$LineColor"  
     ForEach ($i in ($table | ? { $_.ObjectName -eq $Counter -and $_.Path -like "$Server*" }) ) {   
       $GraphName.Series["$Counter"].Points.addxy( ($i.DateTime -split ' ')[0] , $i.AverageValue )   
     }  
     $num++ # Next Color :)  
   }  
   $GraphName.SaveImage("$scriptpath\$Server.png","png") # Save the GRAPH as PNG  
 }  

Have fun! :)

Wednesday, April 6, 2016

OpsMgr (SCOM) - Alerts per group SQL Query (+) Datazen Dashboard

Since i showed up how to get it in a last post, a PFE friend of mine noticed something it migh consern, and to be honest i didn't pointed out because to me was not an issue, but, i understand it might me to some of you.

It doesn't give you a recursive membership alerts.
My older post will only give you object specific alerts on that group, "nothing else"!
So, i started to think on how i could help me (and you!) out with this "issue", and came up with this ideia.

First, i've showed how to do this by powershell.
All alerts for specific group, in a specific time range, and for specific severity - this were my filters.
But, how can i "translate" powershell into SQL ?
SQL-Profiler!
Basically when you run a powershell cmd-let like :
Get-SCOMAlert -Criteria (...)
You're connecting into OperationsManager database and making a query.

So, the query goes as follow:

First, i create a temp table i can put my "groups".

DECLARE @TMP_GROUP_TABLE table(BaseManagedEntityId uniqueidentifier, DisplayName varchar(50));  
 INSERT INTO @TMP_GROUP_TABLE  
 SELECT BaseManagedEntityId, DisplayName FROM basemanagedentity WITH (nolock)  
 WHERE DisplayName = ('Group Name Here')  
 OR DisplayName = ('Other Group')  
 OR DisplayName = ('Other Group')  
 OR DisplayName = ('Other Group')  
 OR DisplayName = ('Other Group')  
 OR DisplayName = ('Other Group')

Then, the magic query - it's already made up to join the temp table and add the group name in the end of it :) (Promise i'll make a post about SQL-Profiler!)

 DECLARE @LanguageCode1 varchar(3)  
 DECLARE @LanguageCode2 varchar(3)  
 DECLARE @ParentManagedEntityId uniqueidentifier  
 DECLARE @ResolutionState0 nvarchar(max)  
 DECLARE @Severity0 nvarchar(max)  
 DECLARE @TimeRaised0 datetime  
 SET @LanguageCode1='ENU' ; SET @LanguageCode2=NULL  
 SET @ResolutionState0=N'0' ; SET @Severity0=N'1'; SET @TimeRaised0='2016-04-04 00:00:00'  
 SELECT DISTINCT [AlertView].[Id],[AlertView].[Name],[AlertView].[Description],[AlertView].[MonitoringObjectId],[AlertView].[ClassId],[AlertView].[MonitoringObjectDisplayName],[AlertView].[MonitoringObjectName],  
                 [AlertView].[MonitoringObjectPath],[AlertView].[MonitoringObjectFullName],[AlertView].[IsMonitorAlert],[AlertView].[ProblemId],[AlertView].[RuleId],[AlertView].[ResolutionState],[AlertView].[Priority],  
                 [AlertView].[Severity],[AlertView].[Category],[AlertView].[Owner],[AlertView].[ResolvedBy],[AlertView].[TimeRaised],[AlertView].[TimeAdded],[AlertView].[LastModified],[AlertView].[LastModifiedBy],  
                 [AlertView].[TimeResolved],[AlertView].[TimeResolutionStateLastModified],[AlertView].[CustomField1],[AlertView].[CustomField2],[AlertView].[CustomField3],[AlertView].[CustomField4],[AlertView].[CustomField5],  
                 [AlertView].[CustomField6],[AlertView].[CustomField7],[AlertView].[CustomField8],[AlertView].[CustomField9],[AlertView].[CustomField10],[AlertView].[TicketId],[AlertView].[Context],[AlertView].[ConnectorId],  
                 [AlertView].[LastModifiedByNonConnector],[AlertView].[MonitoringObjectInMaintenanceMode],[AlertView].[MonitoringObjectHealthState],[AlertView].[ConnectorStatus],[AlertView].[RepeatCount],  
                 [MT_Computer].[NetbiosComputerName],[MT_Computer].[NetbiosDomainName],[MT_Computer].[PrincipalName],[AlertView].[LanguageCode],[AlertView].[AlertParams],[AlertView].[SiteName],  
                 [AlertView].[MaintenanceModeLastModified],[AlertView].[StateLastModified],[AlertView].[TfsWorkItemId],[AlertView].[TfsWorkItemOwner],  
                 [TEMP].DisplayName AS GroupName  
 FROM dbo.fn_AlertView(@LanguageCode1, @LanguageCode2) AS AlertView   
 LEFT OUTER JOIN dbo.MT_Computer ON AlertView.TopLevelHostEntityId = MT_Computer.BaseManagedEntityId  
 INNER JOIN dbo.RecursiveMembership AS RM ON AlertView.MonitoringObjectId = RM.ContainedEntityId   
 INNER JOIN @TMP_GROUP_TABLE AS TEMP ON RM.ContainerEntityId = TEMP.BaseManagedEntityId  
 WHERE (AlertView.[ResolutionState] = @ResolutionState0   
 AND AlertView.[Severity] >= @Severity0   
 AND AlertView.[TimeRaised] > @TimeRaised0)   
 AND (((RM.ContainerEntityId IN ( SELECT BaseManagedEntityId FROM @TMP_GROUP_TABLE ) )))   
 ORDER BY [AlertView].[LastModified] DESC  

Since you got your data into place, let's make the Datazen Dashboard for your teams!


This is a 5 minutes dashboard, you can edit the query to set some "alert thresholds" and create a more "KPI" oriented alert view dashboad in Datazen.

Cheers,

Monday, April 4, 2016

OpsMgr (SCOM) - Alerts per group SQL Query

A few days ago, i showed up how to get SCOM alerts for a certain group in Powershell.
Now i needed to put it in DataZen and i could, but it's more simple to get data by SQL, so, the query i came up with is this :

 DECLARE @TMP_GROUP_TABLE table(groupname varchar(50));  
 insert into @TMP_GROUP_TABLE   
 values('Group #1'), -- List  
      ('Group #2'), -- Of   
      ('Group #3'), -- Groups   
      ('Group #4'), -- You  
      ('Group #5') -- Want  
 SELECT   
     s.displayName as [Group],   
     CASE WHEN t.Path IS NULL THEN t.DisplayName ELSE t.path END AS [CI],  
     av.AlertName as [Alert Name],  
     av.AlertDescription as [Description],  
     count(av.AlertName) as [AlertCount],  
     ResolutionState, RaisedDateTime,av.Severity  
 FROM vrelationship r   
      inner join vManagedEntity s on s.ManagedEntityRowId = r.SourceManagedEntityRowId   
      inner join vManagedEntity t on t.ManagedEntityRowId = r.TargetManagedEntityRowId   
      inner join Alert.vAlert av on av.ManagedEntityRowId= t.ManagedEntityRowId  
      inner JOIN Alert.vAlertDetail adv on av.AlertGuid =adv.AlertGuid   
      inner JOIN Alert.vAlertResolutionState arsv on av.AlertGuid =arsv.AlertGuid   
      inner JOIN Alert.vAlertParameter apv on av.AlertGuid =apv.AlertGuid   
 WHERE   
      -- I choose 7 days, you can put a value as you like  
      RaisedDateTime >=DATEADD(day,-7,GETDATE())  
      and s.DisplayName IN ( SELECT groupname FROM @TMP_GROUP_TABLE )  
      -- Filter only for CRIT and WARN alarms  
      AND av.Severity >= 1  
 group by s.displayName,t.displayname,av.AlertDescription,ResolutionState,RaisedDateTime,av.Severity,av.AlertName,t.Path  
 order by AlertCount desc  

This is good so you can create a nice Datazen dashboard to keep teams up with their alarms (you can put their objects inside respective groups).

Feel free to criticize, no SQL master at all (lol!)

Thursday, March 31, 2016

OpsMgr (SCOM) - Powershell Event Views Dashboard

I don't like the idea to have lot's of console connecting to my Management Servers, so i give my clients the webconsole link.
But, as you migh know, there's a bunch of limitiations, like "Event Views" don't show up.
So, i had the need to overcome this issue.

Solution was to put Powershell in a SCOM Dashboard.

First, create a new Powershell Grid Layout "Dashboard View" with one cell.
Configure it and paste this code :

 # This example is for a Rule i have for unexpected restart/shutdowns (EventID = 1074)  
 # You can change as you want!  
 $a = Get-SCOMManagementGroup  
 $b = New-Object Microsoft.EnterpriseManagement.Monitoring.MonitoringEventCriteria "RuleId='e7c857e6-7654-5f89-ecdf-8f93325c83ee'"  
 $Events = $a.GetMonitoringEvents($b)  
 $i = 0  
 foreach ($Event in $Events) {  
   $EventDescription = 'User : ' + [string]$Event.Parameters[6] + ' || Type : ' + [string]$Event.Parameters[4] + ' || Reason : ' + [string]$Event.Parameters[5]  
   $TimeAdded = $Event.TimeAdded  
   $LoggingComputer = [string]$Event.LoggingComputer  
   $dataObject = $ScriptContext.CreateInstance("xsd://foo!bar/baz")  
   $dataObject["Id"]=$i.toString()  
   $dataObject["TimeAdded"]=$TimeAdded  
   $dataObject["LoggingComputer"]=$LoggingComputer  
   $dataObject["Description"]=$EventDescription  
   $ScriptContext.ReturnCollection.Add($dataObject)  
   $i++  
 }  

:) Enjoy!

Friday, March 4, 2016

OpsMgr (SCOM) - Alert Views without any console ?

Recently i got the need to put "Alert Views" on 4 different Teams TV's.

My first though was ... "WebConsole can't do the job ..."
So i remembered that PS1 could save my day!

Cons:

- SCOM Web Console too slow;
- You need IE;
- ... and silverlight;

Solution :

- Created a PS1 that for every different group i want gets latest 24h alerts (Warn/Crit);
- Foreach group i create an HTML file and put it on my favourite Web-Server;
- Created a Runbook that for a 90 seconds schedule runs the PS1;
      - You can also have a Scheduled Task for the Job;
- HTML has a meta tag that makes HTML refresh every 30 seconds;


 Import-Module OperationsManager  
 New-SCOMManagementGroupConnection -ComputerName "SCOMSERVER_GOES_HERE"  
 $MyGroups = @()  
 Foreach ($item in Get-Content C:\OpsMgr\WebAlertViews\conf\Groups.conf ) {  # Dont Forget to change this!
     $MyGroups += Get-SCOMGroup -DisplayName $item  
 }  
 $newTime = (Get-Date).AddHours(-24)  
 $Criteria = New-Object Microsoft.EnterpriseManagement.Monitoring.MonitoringAlertCriteria("ResolutionState = 0 AND Severity >= 1 AND TimeRaised > `'$newTime`'")  
 $TransversalDepth = [Microsoft.EnterpriseManagement.Common.TraversalDepth]::Recursive  
 Foreach ( $Group in $MyGroups ) {  
     $Head = "<meta http-equiv='refresh' content='30'>"  
     $Head +="<style>"  
     $Head +="BODY{background-color:White;font-family:Verdana,sans-serif; font-size: x-small;}"  
     $Head +="TABLE{font-family: verdana,arial,sans-serif; font-size:12px; color:#333333; border-width: 1px; border-color: #666666; border-collapse: collapse;}"  
     $Head +="TH{border-width: 1px; padding: 8px; border-style: solid; border-color: #666666; background-color: #dedede;}"  
     $Head +="TD{border-width: 1px; padding: 8px; border-style: solid; width:auto;}"  
     $Head +="</style>"  
     $Body = "<br><br>"  
     $Body += "<img src='.\images\nos_logo_detail.png' height='12%' width='12%'>"  
     $Body += "<center><h1 style=color:#999999>.: Relatório SCOM - Alert View | $(($Group).DisplayName) :.</center>"  
     $Body += "<center><table>"  
     $Body += "<tr>"  
     $Body += "<td>Severity</td>"  
     $Body += "<td>Time Raised</td>"  
     $Body += "<td>Path</td>"  
     $Body += "<td>Name</td>"  
     $Body += "<td>DisplayName</td>"  
     $Body += "<td>Description</td>"  
     $Body += "</tr>"  
     $Alerts = $Group.GetMonitoringAlerts( $Criteria, $TransversalDepth )  
     Foreach ($Alert in $Alerts ) {  
         If ($Alert.Severity -eq 2) { $image = 'critical.png' }  # You need this files
         If ($Alert.Severity -eq 1) { $image = 'warning.png' }  
         $Body += "<tr>"  
         $Body += "<center><td><img src='.\images\$Image' height='25px' width='25px'></td></center>"  
         $Body += "<td>$(($alert).TimeRaised)</td>"  
         $Body += "<td>$(($alert).MonitoringObjectPath)</td>"    
         $Body += "<td>$(($alert).Name)</td>"  
         $Body += "<td>$(($alert).MonitoringObjectDisplayName)</td>"  
         $Body += "<td>$(($alert).Description)</td>"  
         $Body += "</tr>"  
     }      
     $Body += "</table></center>"  
     # I got the above replace because of "Unix/Linux Group!"
     $HTMLFileName = (($Group.DisplayName -replace '/','_') -replace ' ','') + '.html'  
     $HTML = ConvertTo-Html -Head $head -Body $Body  
     $HTML > \\MyWebServer\SiteName\AlertViews\AlertView_$HTMLFileName    
 }  

Tuesday, February 16, 2016

[SCOM & Orchestrator] - Alert Forwarding

Let's analyse this scenario:

You want SCOM to forward alerts or open alerts as incidents in a third-party software.

Cons:
SCOM have a limitation when it comes to process alerts;
Only "Notification Pool Members" can manage notifications;
If your channel/subscrition relationship is heavy, you might get a problem - unmanaged alerts.

Pros:
All the Cons! :)

Now, the idea : (Thanks to a PFE friend! MD Thank you!)
What about SCOM just mark the alerts with some kind of tag, and then let Orchestrator listening for that tag, and let Orchestrator do the rest ?
So, for every subscription i've i call a powershell script based channel with this code :
Param([string]$AlertId,[string]$subscriptionID)
Import-Module OperationsManager
$MySubId = $subscriptionID.toString()
$MyAlertId = $AlertID.toString()
$sub = (Get-SCOMNotificationSubscription -Id $MySubId).DisplayName
Get-SCOMAlert -Id $MyAlertId | Set-SCOMAlert -CustomField5 ":waiting" -CustomField6 $sub

On the other hand i've got a channel (command line) based, configured like this :
Full Path of the command line : C:\Windows\system32\WindowsPowerShell\v1.0\powershell.exe
Command line parameters : -Command "& '"C:\OpsMgr\Powershell\Notifications\_OpsMgr_Set-SCOMAlert.ps1"'" -alertID '$Data/Context/DataItem/AlertId$' -subscriptionID '$MPElement$'
Startup folder for the command line : C:\Windows\system32\WindowsPowerShell\v1.0\


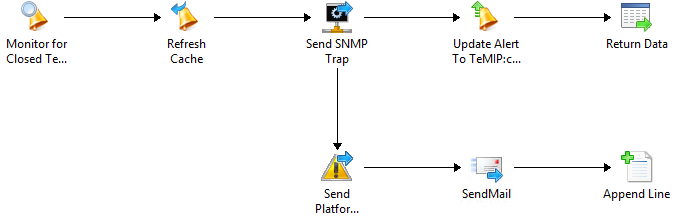
And i've got this runbook on the other side (Orch):

1) Create alerts on the other side :

2) Close alerts on the other side : (If a SCOM Alert gets closed!)

In my case i send a SNMP Trap to my "central" alarm system with specific identifiers, and when i do it i mark the "-CustomField5" as Forwarded just to make sure and let everyone know that my alarm was processed.

If you have any questions, just let me know! :)

Cheers